


Infographics have emerged as one of the most effective tools for visual storytelling. Whether you’re a startup based in Nairobi, a corporate brand in Kisumu, or a creative agency in Mombasa, using infographics can help you simplify complex ideas, boost your brand visibility, and engage your audience faster.
In this article, we’ll explore real, practical infographics examples that stand out in the market. These are designs every Kenyan brand can learn from, whether your goal is marketing, education, awareness, or internal communication.
What Are Infographics and Why Are They Effective?
Infographics are visual representations of information, statistics, or concepts, presented in a clear and digestible way. They combine icons, typography, data charts, and structured layouts to help users absorb content quickly and remember it longer.
Benefits of Infographics:
-
Simplifies complex information
-
Increases content engagement
-
Enhances visual storytelling
-
Boosts SEO through image indexing
-
Drives social media shares and traffic
Studies show that visual content is processed 60,000 times faster than text, and infographics get shared three times more often on social media compared to standard content. For a Kenyan audience increasingly consuming content via mobile, infographics offer an ideal communication format.
Why Infographics Matter for Kenyan Brands
Kenya’s digital market is growing fast, and brands need to present their information in ways that are easy to understand and remember. Whether you’re in agriculture, fintech, health, real estate, or retail, infographics help you communicate more clearly.
They also bridge gaps in literacy and language by reducing dependence on lengthy text and allowing your message to travel further, especially on platforms like WhatsApp, Facebook, and Instagram, where image-driven content performs better.
10 Eye-Catching Infographics Examples Every Kenyan Brand Can Learn From
Below are ten infographics examples that you can adapt to different industries and objectives in Kenya.
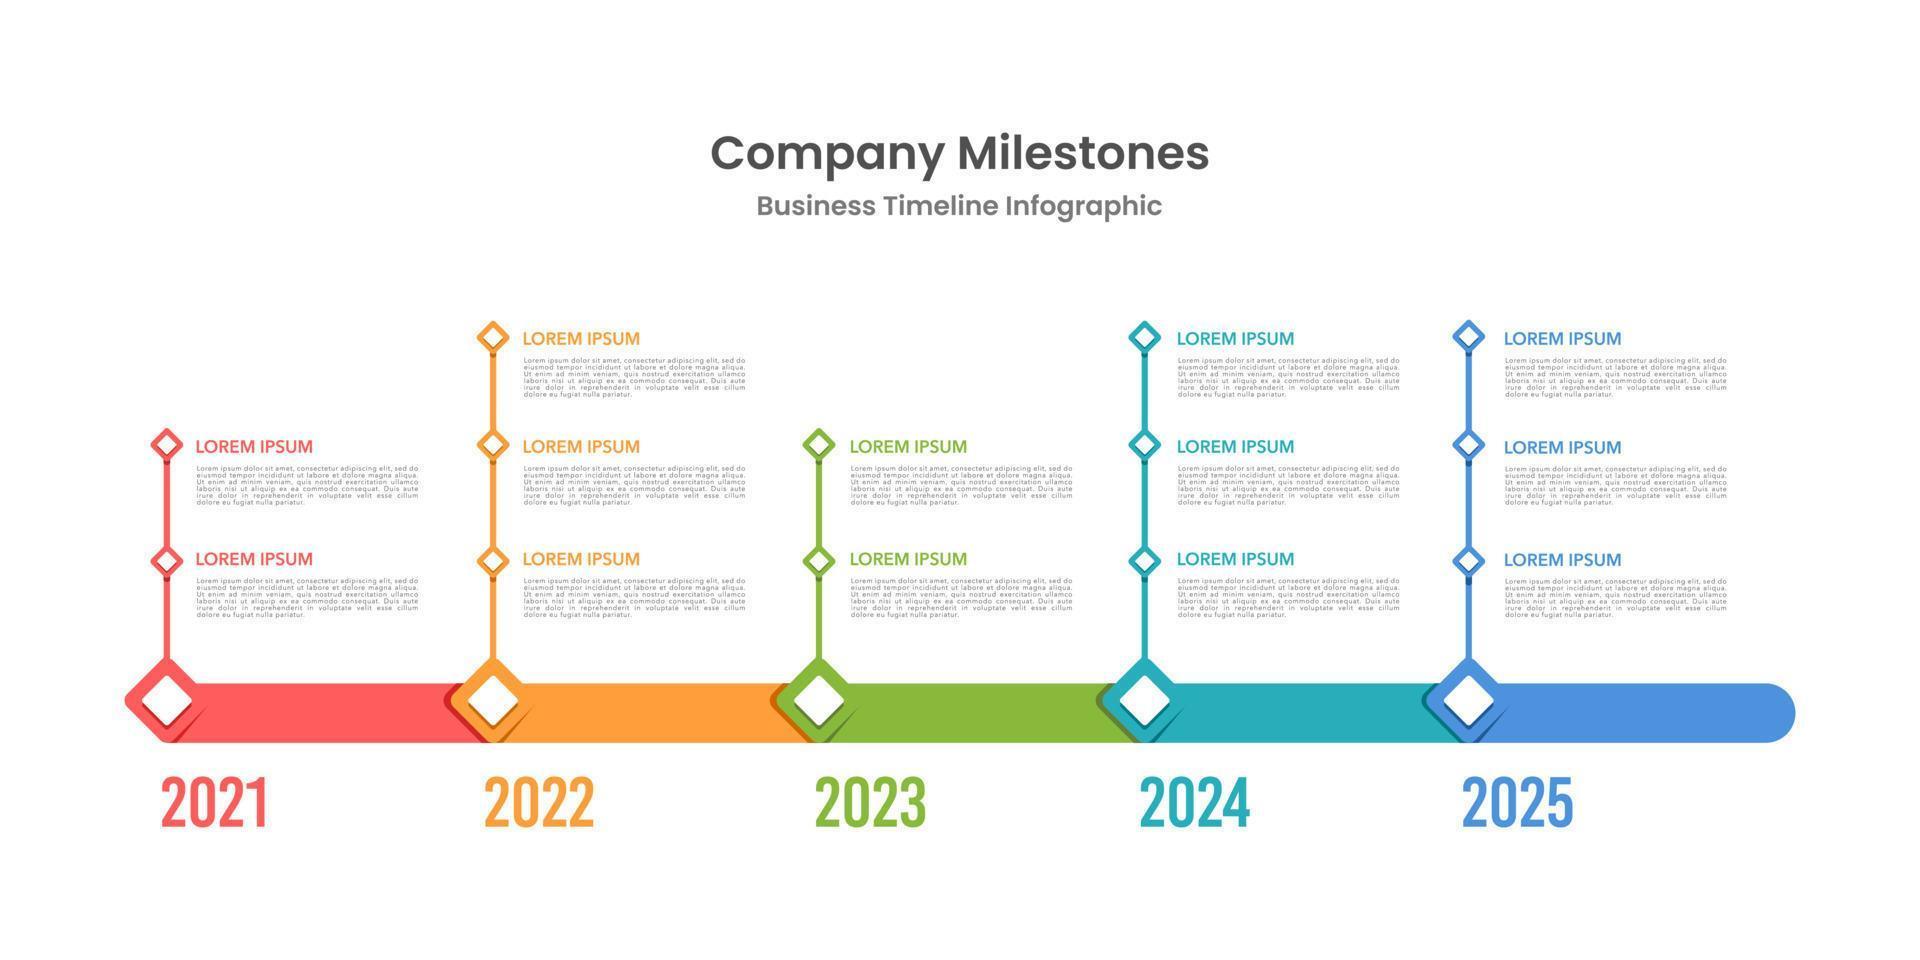
1. Timeline Infographic – Kenyan Startup Milestones
Perfect for startups and personal brands, timeline infographics showcase key events over time. A Nairobi-based startup, for instance, could use this to show their journey from founding to funding rounds or product launches.
Why it works:
-
Visually maps growth
-
Ideal for investor decks
-
Builds brand story in one glance
2. Statistical Infographic – Market Trends in Kenya
Great for sectors like finance, health, or agriculture, statistical infographics present survey results or market data using pie charts, bar graphs, and line charts. A Kenyan tech firm might use it to visualize smartphone usage growth across counties.
Why it works:
-
Simplifies numbers
-
Boosts credibility
-
Excellent for reports and blog content

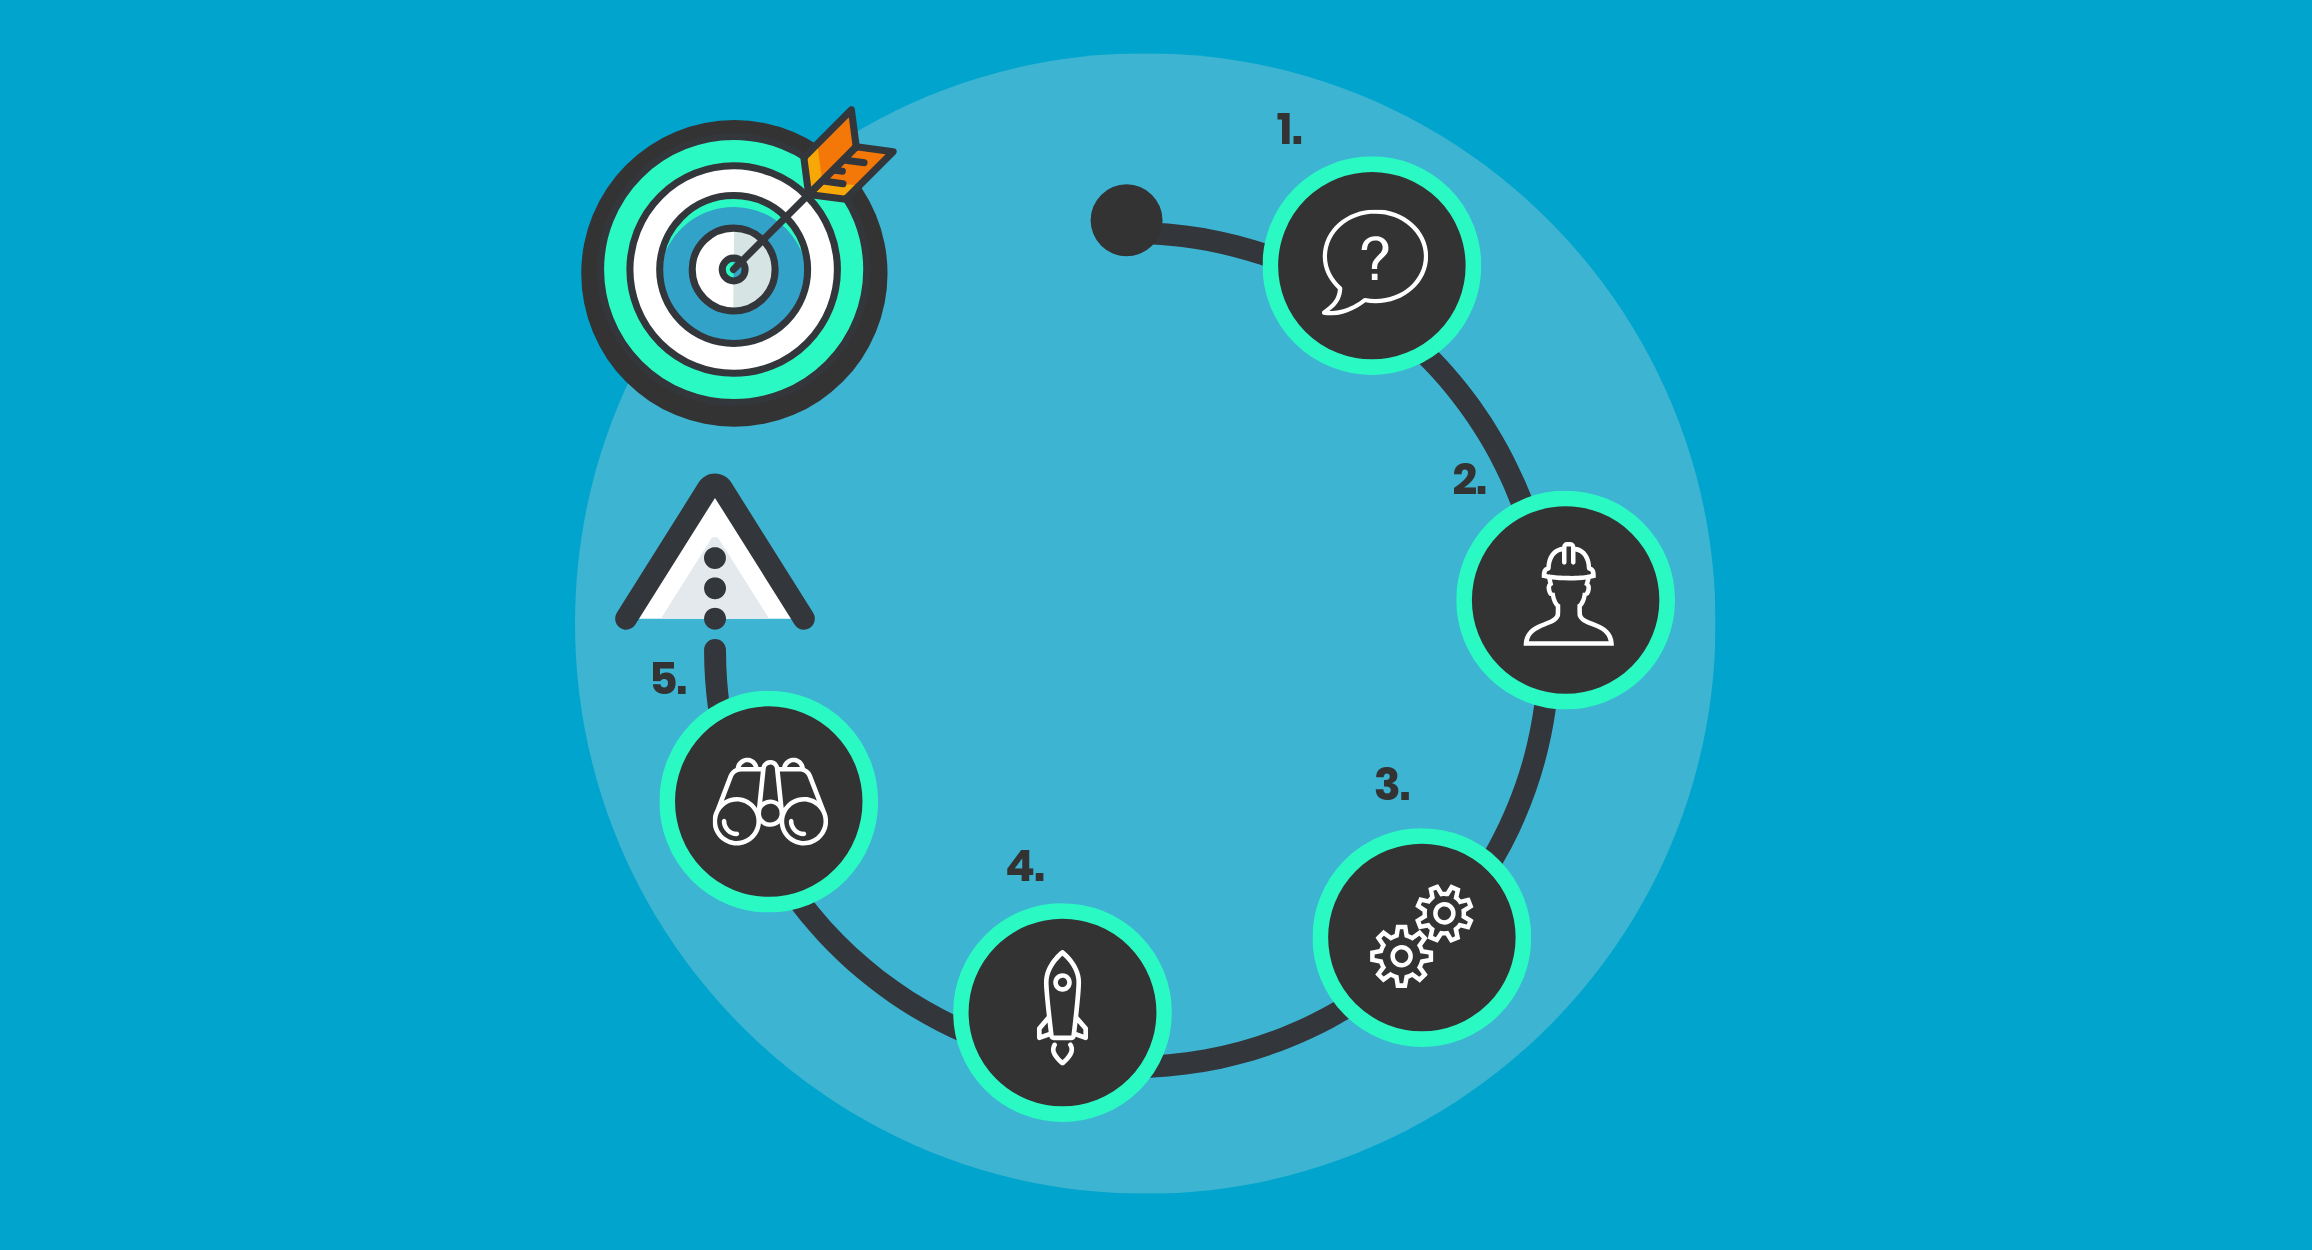
3. Process Infographic – How Your Service Works
For service-based businesses like logistics, cleaning services, or software platforms, process infographics break down the steps your customers will go through. This helps set expectations and clarifies your workflow.
Why it works:
-
Improves user understanding
-
Reduces inquiries
-
Fits perfectly on landing pages
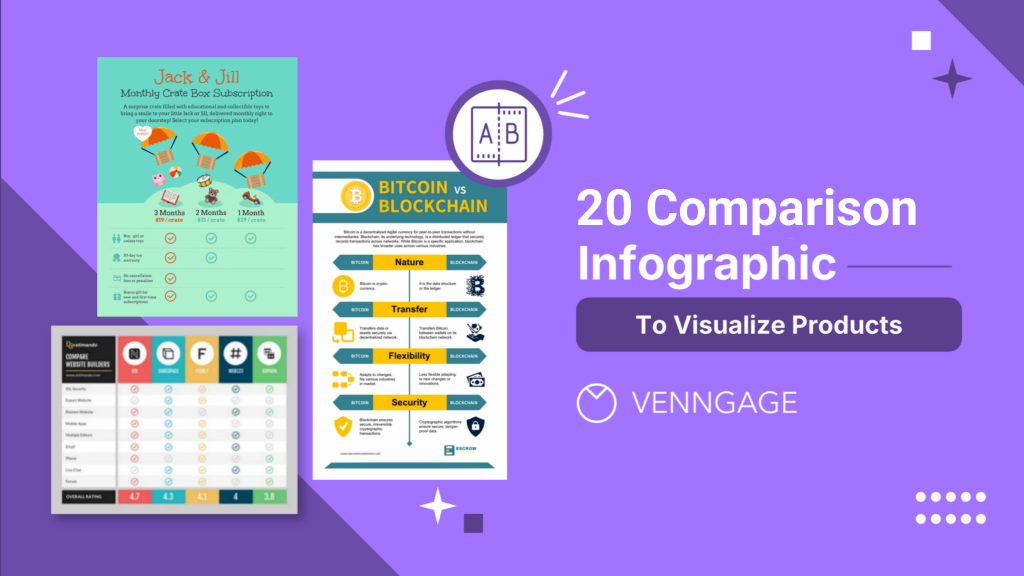
4. Comparison Infographic – Before vs. After Using Your Product
Ideal for skincare, fitness, tech, or interior design brands, comparison infographics contrast life with and without your product or service. This visual storytelling drives emotional impact and buyer confidence.
Why it works:
-
Clearly shows results
-
Encourages action
-
Great for social proof
5. List Infographic – Tips or Reasons
List infographics are useful for content creators, coaches, or educators. For example, a blog post titled “5 Reasons to Start Saving Early in Kenya” can be transformed into a visually attractive, list-based infographic.
Why it works:
-
Easy to skim
-
Shareable across platforms
-
Can double as a lead magnet
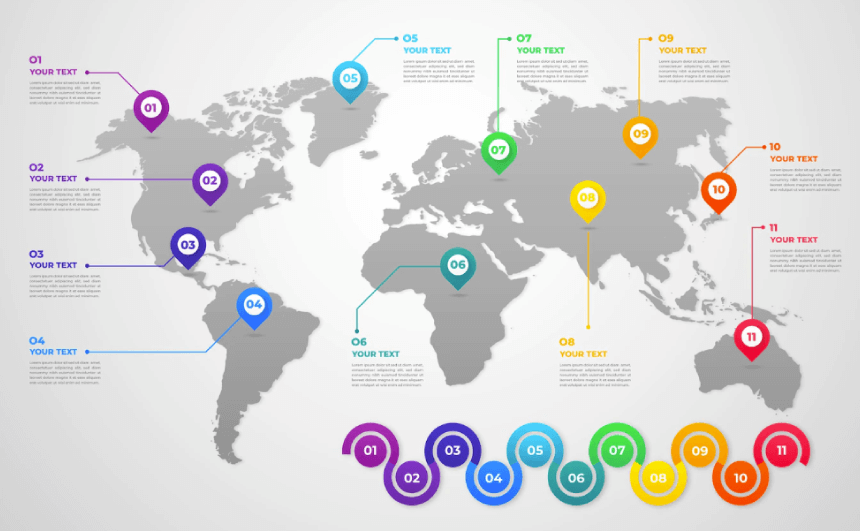
6. Map Infographic – Regional or County-Based Data
A map of Kenya can be used to highlight regional data like COVID-19 impact, literacy rates, or product adoption. NGOs, logistics companies, and public sector brands can use this to localize their messaging.
Why it works:
-
Highly contextual to Kenya
-
Drives localized insights
-
Adds authority to your research
7. Interactive Infographic – Clickable Visuals on Web Pages
With tools like Visme or Figma, you can create interactive infographics where users can click, hover, or scroll through content. A university might use this to display academic departments, or a real estate site could highlight available properties.
Why it works:
-
Encourages engagement
-
Boosts SEO dwell time
-
Professional and modern

8. Social Media Infographic – Quick Tips or Quotes
Designed for fast sharing on Instagram, LinkedIn, or WhatsApp, these infographics deliver bite-sized knowledge or inspirational quotes in an easy-to-read visual format. For example, “5 Healthy Habits for Nairobi Professionals.”
Why it works:
-
High engagement
-
Easily digestible
-
Works well in carousels or stories

9. Brand Story Infographic – About Us at a Glance
This format is ideal for telling your brand’s origin, mission, and growth. You can use it in your pitch deck, website, or even printed brochures. Brands with strong social impact or unique founding stories benefit greatly from this layout.
Why it works:
-
Builds emotional connection
-
Strengthens brand personality
-
Makes your history visually memorable

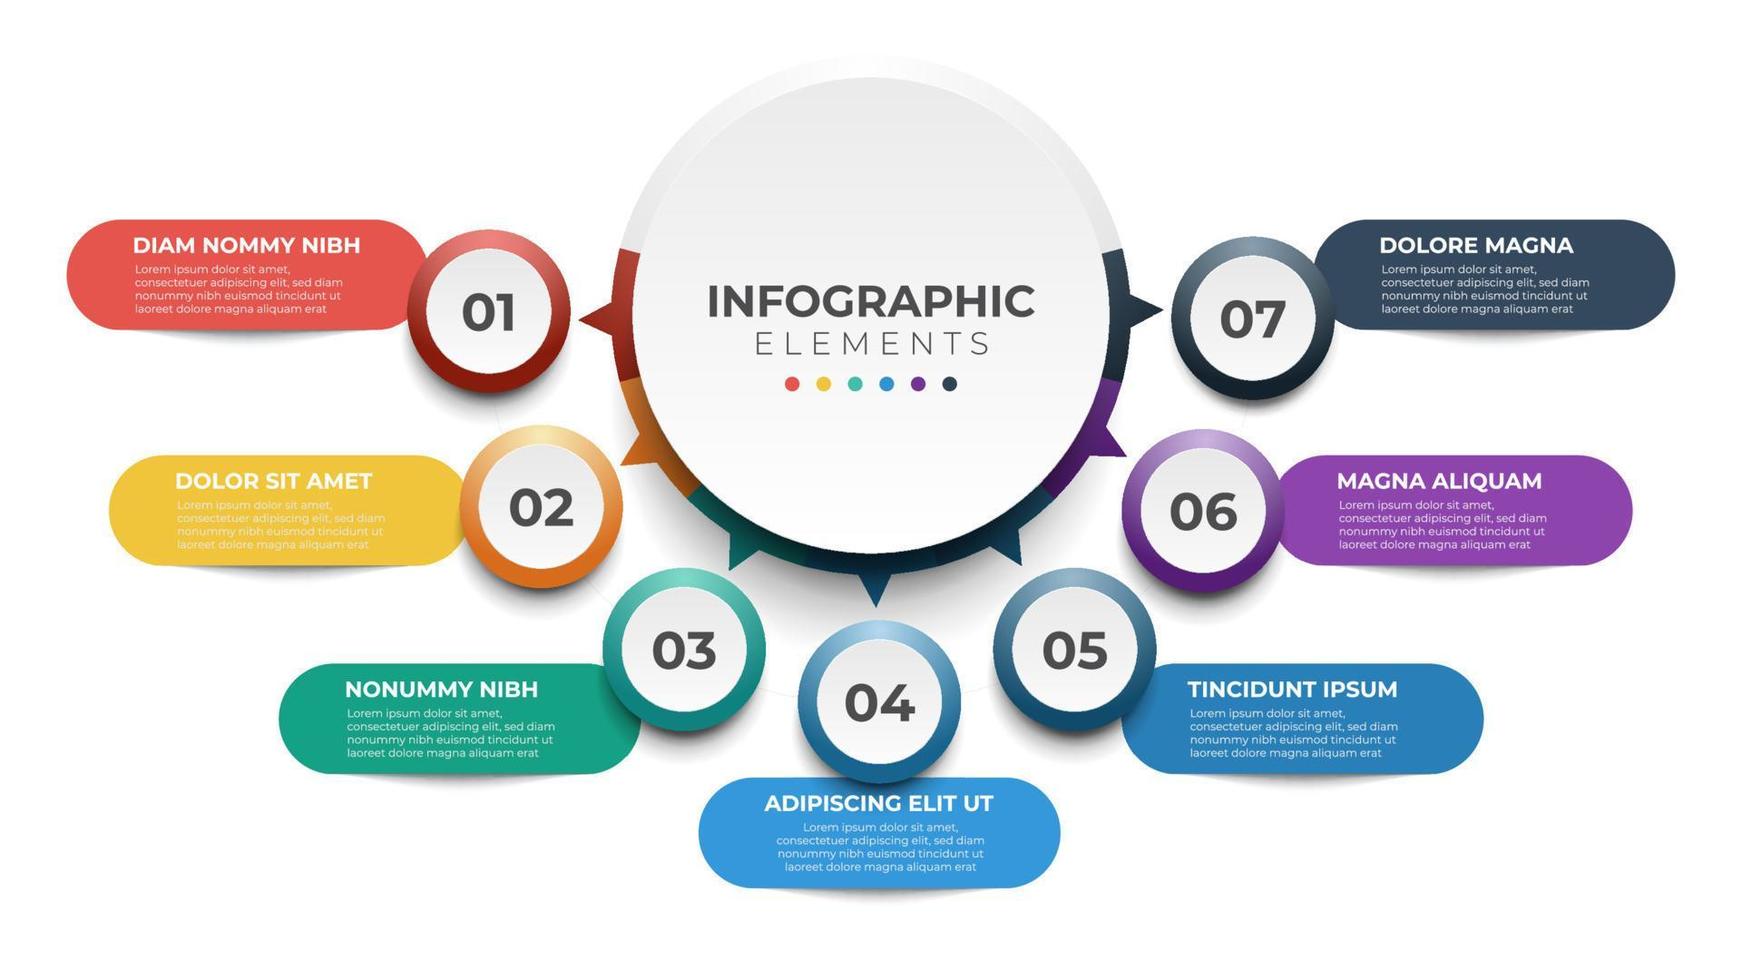
10. Product Feature Infographic – What Your Product Offers
This infographic type breaks down your product’s features and benefits using icons and small blocks of text. For example, a tech company might use this to explain its app features, or a fashion brand could highlight clothing material and sizes.
Why it works:
-
Explains value quickly
-
Useful for e-commerce listings
-
Boosts conversions

How to Create Effective Infographics for Your Kenyan Brand
Seeing inspiring infographics examples is helpful, but applying good design practices is what turns an average visual into a powerful communication tool.
Key Design Tips:
-
Stick to your brand colors
-
Use a consistent font hierarchy
-
Don’t overload with text
-
Always include your logo and contact info
-
Make sure it’s mobile-friendly
-
Compress for fast loading
You don’t have to be a professional designer to make infographics that work. With the right tools and a clear purpose, any Kenyan entrepreneur or marketer can create visuals that stand out.
Tools to Create Infographics
Here are some beginner-friendly tools that work well for infographics creation:
| Tool | Best For | Free Plan |
|---|---|---|
| Canva | Beginners, social media | Yes |
| Visme | Business reports, data design | Yes |
| Adobe Express | Creative visuals and branding | Yes |
| Piktochart | Data visualization | Yes |
| Figma | UI/UX and interactive visuals | Yes |
These platforms offer ready-made templates, icons, charts, and customization features. You can start free and scale up as your needs grow.
Final Thoughts
Infographics are no longer optional—they’re essential for digital communication in Kenya. They help your brand tell stories visually, simplify complex data, and connect with audiences across multiple platforms.
Whether you’re a solopreneur, a government agency, or an established company, adopting the right type of infographic can elevate your content and attract more attention.
If you’re looking to stand out in Kenya’s growing online market, use the infographics examples in this guide as inspiration—and start creating visuals that your audience will remember, share, and trust.


